

A guide and an Excel sheet example about Colorizing test data to create a better overview of what test data is changing.
What is conditional formatting?
Conditional formatting is a feature in excel, to color cell base on their values.
If a cell equals 2, then we can color it green:

If a cell is even, then we can color it blue:

Or even color them in a color range by value:

Why do I need conditional formatting of test data?
To easier understand the test case, by coloring test data, by how they change.
In the following case we give cells yellow color to show, when test data is different from the first test case (so we can see what difference there is between the test cases):
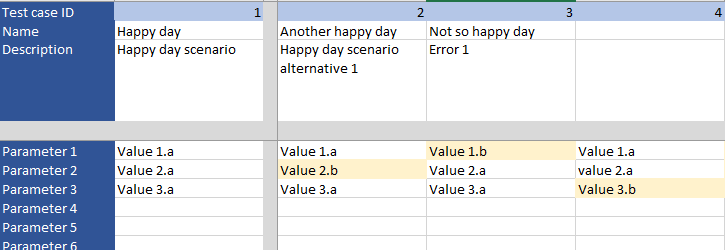
This way it is easy to see, what data has changed from the original happy day test case.
This is excellent especially, when we have a lot of error scenarios and we need to make sure the data is correct. It is important to avoid data blindness.
How to do it?
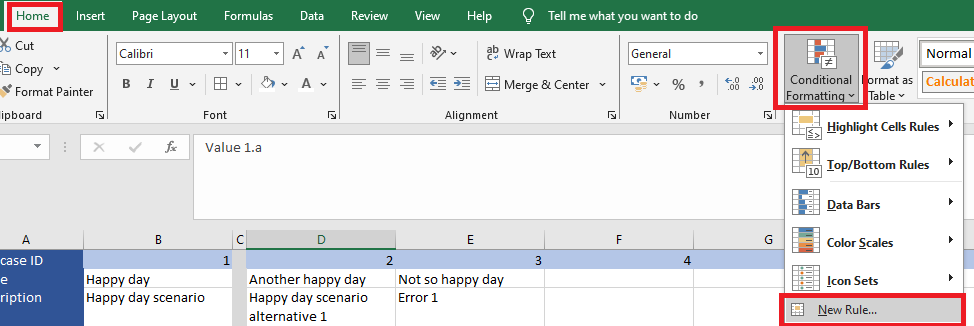
It’s simply done by clicking Home / Conditional Formatting / New Rule…
and adding a form
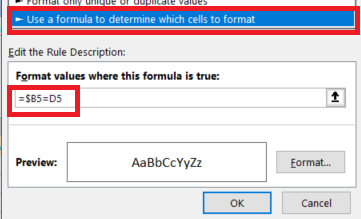
Formular: =$B5=D5
and setting the color formatting to whatever you want.